Numbers, please!
Next, let’s apply the preceding reasoning to actual devices. Reading vendors datasheets can be disconcerting, mostly because of heterogeneity.
As always, it is good to start with the basics. And in this respect old documentation has my favor over the more recent ones.
Maybe the most widespread signal conditioner of all times is the B&K model 2635 charge amplifier. Reading the datasheet [3], the specifications states:
INHERENT NOISE (2 Hz to 22 kHz):
5 10-3 pC referred to input with maximum sensitivity and 1 nF transducer(*) capacitance
Equipped with this information, one can easily arrive at a first estimate of spurious displacements due to electronics self-noise. Here, we should start by making an assumption regarding the sensitivity of our sensor. Let’s assume we are using a general purpose, relatively high-sensitivity piezoelectric accelerometer such as the B&K 4370 or its counterpart 4381. Those sensors deliver 10pC/m/s², so that the inherent noise reads (in acceleration units)
![]()
And the equivalent acceleration PSD reads:
![]()
Now, the corresponding displacement can be estimated as:

This is a pretty impressive result, if you ask me, but of course relies on a wild guess from our side that is : the inherent noise has a sufficiently flat spectrum for our simplified formulas to be applied.
(*) incidentally, this introduces the notion of charge capacitance. For the sake of simplicity, we will ignore this aspect for the moment and come back to it in a second article. The interested readers can start to dig into the subject by reading Enrico Rubiola’s lectures on instruments [3], and in particular the description of thermal noise across a capacitor.
Practical Methods and Results
In practical terms, the preceding discussion is interesting but doesn’t allow for the quantitative determination of actual devices’ instrumental noise. Furthermore, other (extraneous) effects exist so that the environment does contribute to the instrument performance (not in a positive way), and those additionnal effects can only be quantified through testing.
Obviously, one could wish for conducting measurements in a perfectly clean environment (quiet « room »), with controlled external influences, and sufficiently small micro-seismic background noise. This condition can of course be obtained in specific laboratories, such as the Provence based Laboratoire Souterrain à Bas Bruit (LSBB) [4], but we said we wanted practical methods, right ?
To start with, we will use here two fairly simple (but independent) approaches :
- the corrected difference method
- the dummy sensor method
The first method assumes that one has a pair of completely identical sensors, with footprint small enough so that they can be placed side-by-side and measure essentially the same signals. By subtracting the measured signals, all what should be left should be noise (assuming both channels electronics are at least nominally identical). This error signal is multiplied by 0.707, to account for the fact that being independent, the two noise sources will add quadratically, hence the term “corrected”.
The second method assumes we can replace our transducer with an electrically equivalent but vibration insensitive component. In our case, to replace our piezoelectric accelerometers, we will use a 1nF capacitor (off the shelf available from Virtins Technology, see [4]).
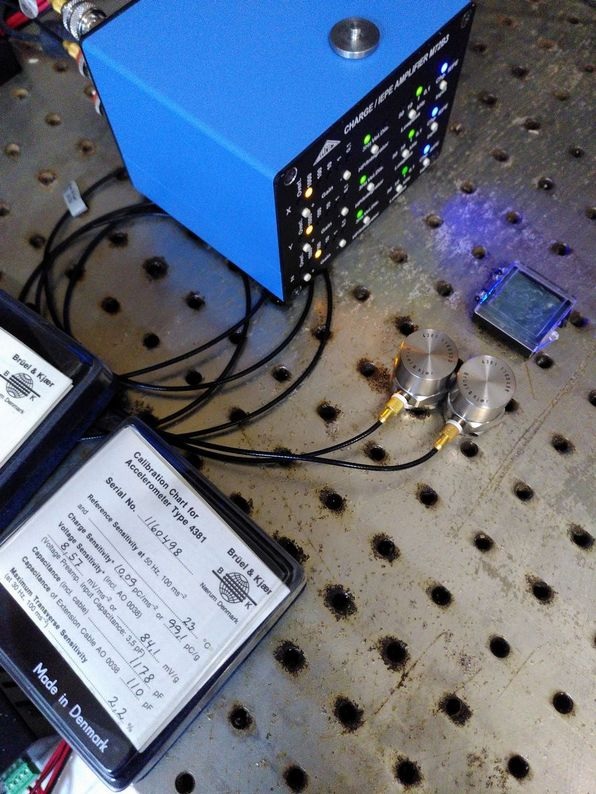 | 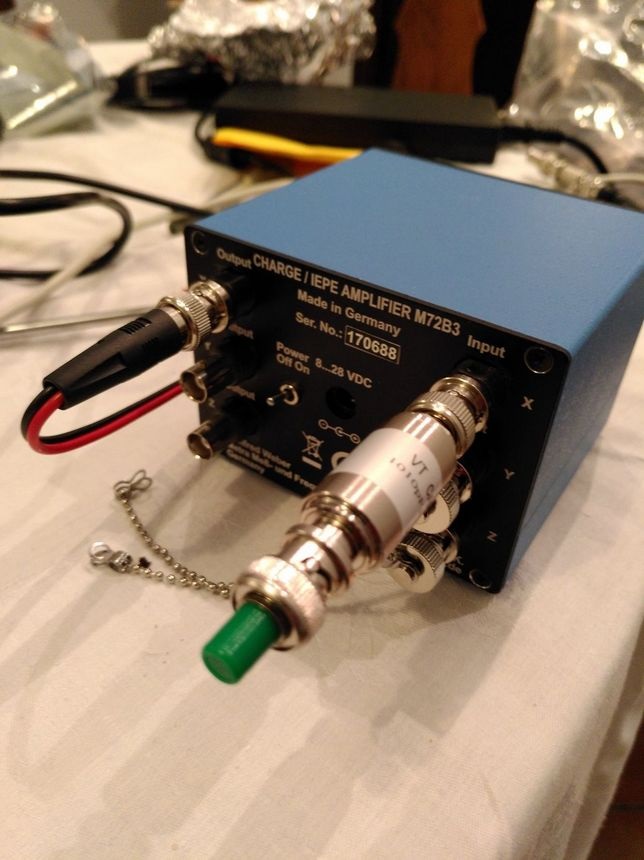 |
Both methods have obvious limits, which for the sake of conciseness we will not address here.
A specific setup has been used, as follows:
- the Device Under Test (DUT) here was a charge/voltage amplifier from MMF (model M72B3), with 3 inputs
- Inputs 1 and 2 were used for the corrected method: connected to B&K 4381 sensors, (sensitivities in agreement within less than 1%). Both sensors are magnetically mounted side-by- onto a 20mm thick steel plate. Connexions are made using low-noise cables (UA0038 from B&K).
- Input 3 has been used for the dummy sensor method: This capacitor is directly connected into the conditionner then fitted with a 50 Ohm termination resistor. At room temperature, such a resistor has a thermal noise slightly below 1nV/sqrt(Hz), so largely negligible for our purpose.
- All channels have a gain of 100, a 3Hz (analog) high-pass filter is activated.
- all signals are measured thanks to an ultra low-noise DAQ: Data Translation model DT9824A, (readout noise below 0.3microVolt/sqrt(Hz) )
- the setup was placed in a quiet room (acoustic noise level below 40dB(A) with minimal electrical and mechanical perturbations (basement room, the optic table resting against a wall)). Temperature was between 12 and 13 degrees Celsius, and relative humidity between 50 and 55%.
Let’s start by examining the results in terms of acceleration. Recorded time-histories are shown on Figure 1.
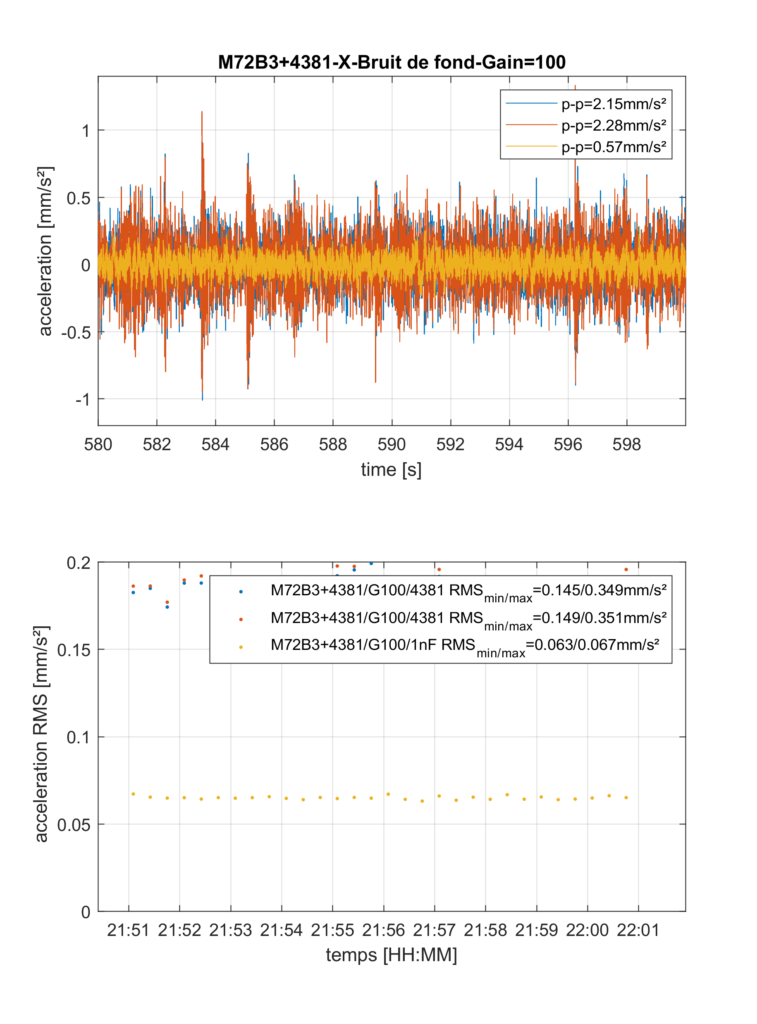
Clearly, the sensors pick up more signal than the intrinsic noise. This is probably more readable in the frequency domain, as show on Figure 2. Here, we restrict ourselves to the 1-200Hz frequency band, which largely covers the useful applications. We use a rectangular window, since we essentially are dealing with wide-band noise. The frequency resolution is set to 0.5Hz, and the duration of each short-term spectrum is 20s.
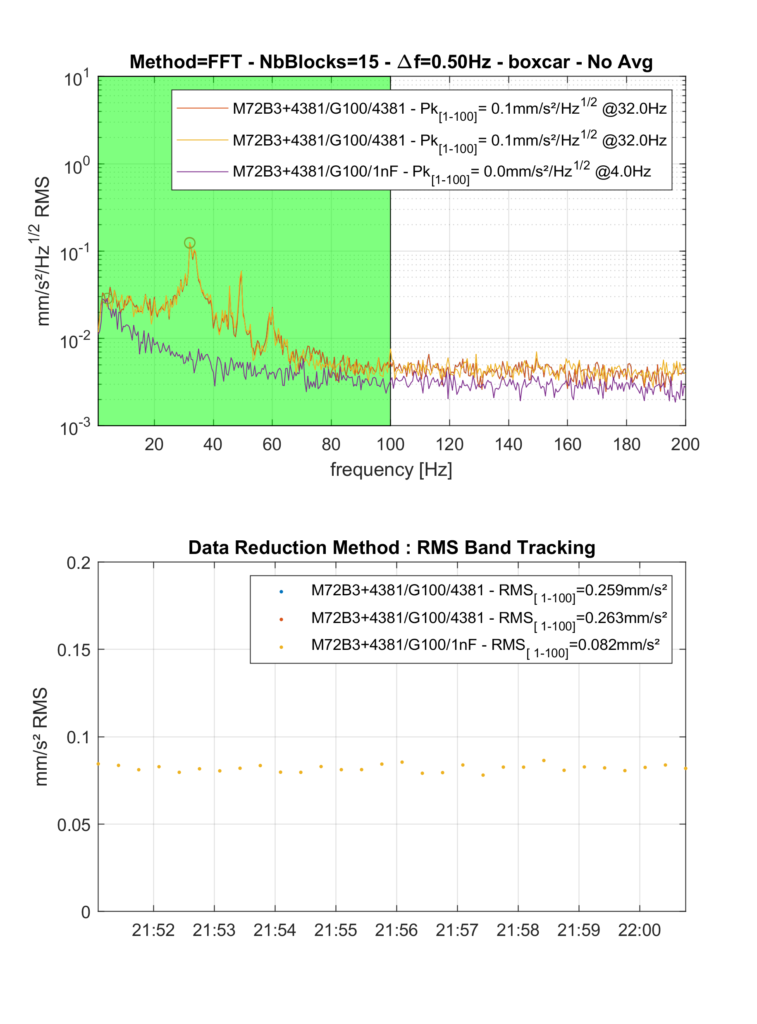
On figure 2, I have superimposed the Amplitude Noise Spectra (ASD, unit: mm/s²/sqrt(Hz)) of the three inputs:
– inputs 1 and 2 are completely identical, and exhibit clear response peaks, undoubtedly coming from mechanical resonances amplifying micro-seismic background noise, whereas
– input 3 exhibits a smooth spectrum, typical of electronic noise,
Those finding are completely in line with our understanding. We can perform double integration, to yield Figure 3. Interestingly, the prominent peaks visible in Figure 2 around 32Hz are compressed by double integration, and the 3 signals have very close RMS displacement values.
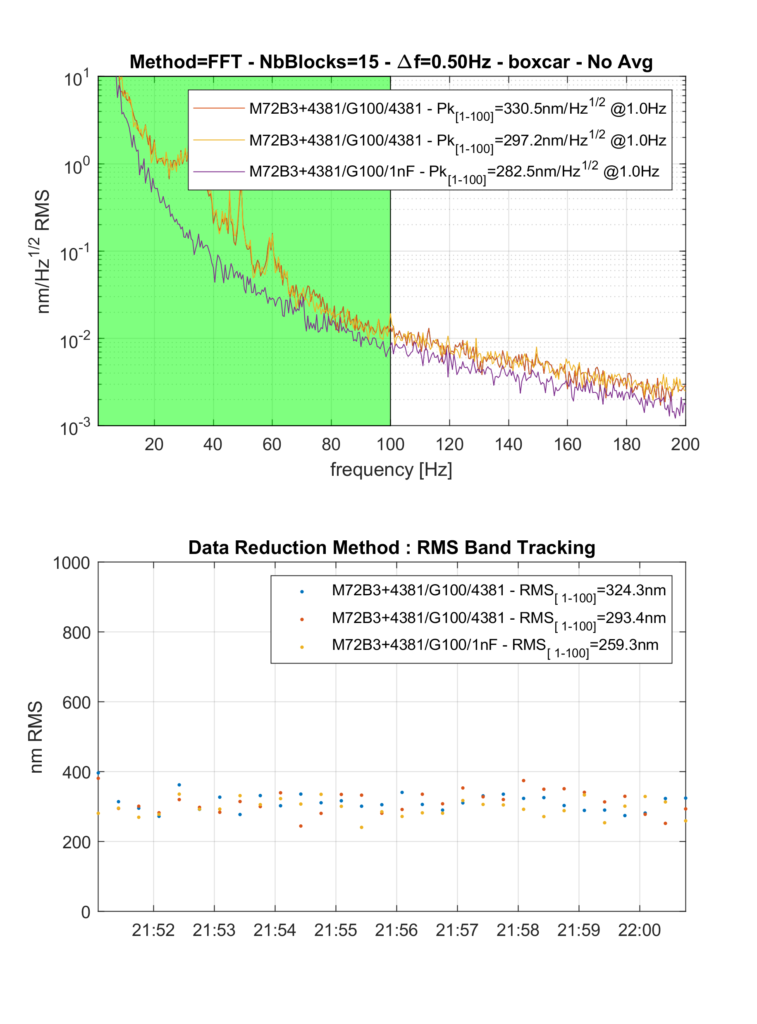
Lastly, by subtracting (in the time domain) signals 1 and 2, and again performing double integration (in the frequency domain), one arrives at Figure 4. The resonance peaks are effectively eliminated (canceled), and both methods do yield essentially the same result, here an inherent noise in the range of 200nm RMS value.
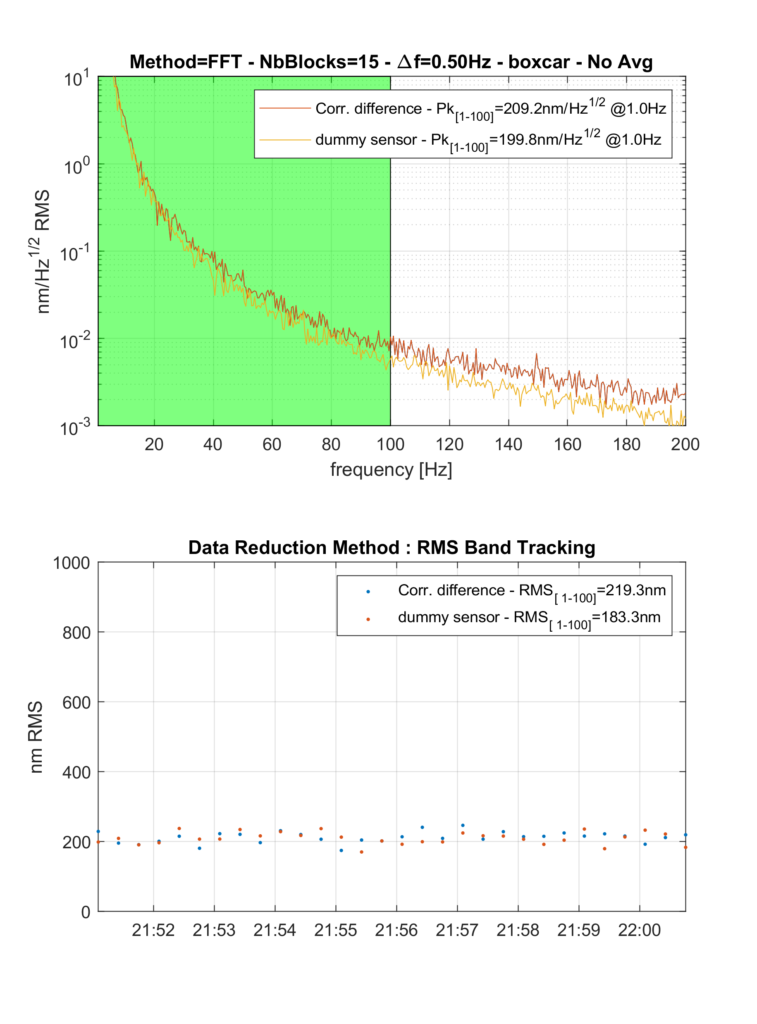
Now, how does this compare to the levels expected without actually performing the test? Based on its vendor datasheet, the M72 series have an inherent noise of respectively 3fC RMS for bandwidth 1 to 10 kHz [5]. This in turn implies an inherent charge noise with ASD of 3.10-2 fc/sqrt(Hz) (referred at input). To convert it to acceleration, we need to account for the sensor sensitivity (10pC/m/s²), yielding an equivalent acceleration ASD of 3.10-6m/s2/sqrt(Hz).
The ‘bottom’ value of the acceleration ASD in figure 2 is of about 0.003.mm/s2/sqrt(Hz) , which exactly matches the estimated value. The important fact, however, is that below 20Hz an additional contribution appears (besides the “flat” thermal noise), which makes our initial estimate in terms of displacement significantly wrong. Since the majority of energy comes from the lower end of the bandwidth, basing our estimate on the “average” ASD over the entire specified band (1 Hz to 10kHz in that case) would result in a level of about :

Since the actual ASD around 1Hz is about 10 times higher, it is not surprising that the final level is significantly larger (a factor of 4 in this case).
